
MacroGrowth, inflation & jobs
US pending home sales fall to a record low as builder confidence hits its lowest level since 2012
Pending home sales fell to the lowest level in NAR's series history in October. Builder sentiment dropped to a 14-year low and purchase applications ran 18% below last year, as rising inventory meets weakening demand at mortgage rates above 7%.
From the Calculated Risk article of November 18, 2026 and cited sources: Buyer demand weakened sharply. [2] [3] [8] [10]
SOURCES[2] NAR Pending Home Sales, October 2026 nar.realtor[3] IndexBox indexbox.io[8] HousingWire: MBA applications housingwire.com
 AT Pulse research deskPublished · Updated · 4 min read · AI-assisted analysis
AI-assisted, not human-edited. Methodology Corrections Who owns this site
- Original source
- Calculated Risk article, independent perspective
- Brief by
- AT Pulse research desk AI-assisted; publisher and contact on the desk page
- When
- November 18, 2026 article published
- Covered
- Nov 19 edition
- Evidence
- 12 sources across 10 sites
RisingHow it’s measured
Substack · 17 likes · 1 share
Reach blends public engagement (views, likes, comments, shares, stars) from the platforms where the story or its original source lives: YouTube, Hacker News, GitHub, Substack and similar. A video and the article written from its transcript share one score, taken from the video. Platforms with no data are left out rather than counted as zero, and the age of a story never lowers its score.
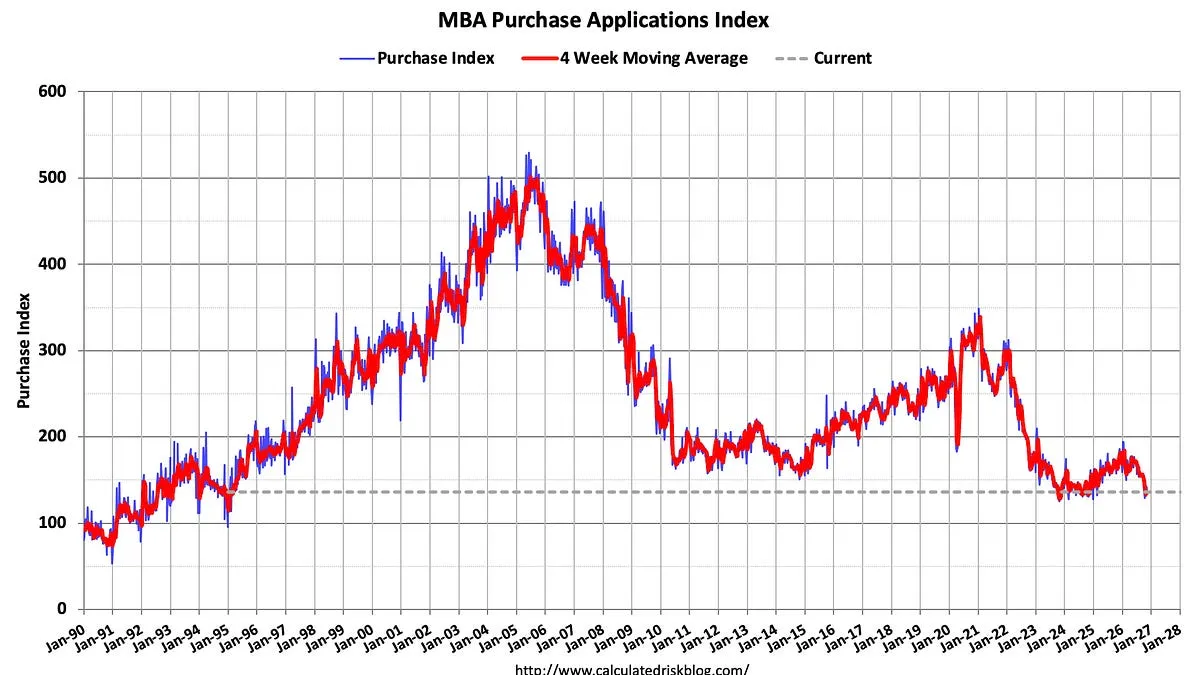
Buyer demand weakened sharply. NAR's Pending Home Sales Index fell to 63.0 in October, the lowest since the series began in 2001. It was down 4.7% from September, with declines in all four regions, and 16.7% from a year earlier. Economists polled by Reuters had expected a 2.0% monthly drop. In the week ending Nov 13, MBA purchase applications were about 18% below a year earlier and refinances were about 54% lower. [2] [3] [8] [10]
Builder sentiment fell to its lowest since April 2012. The NAHB/Wells Fargo index dropped 4 points to 25, and buyer traffic fell to 16. 46% of builders cut prices, the highest share since Covid, and 68% offered incentives. [6] [7] [9]
Supply is growing again. Realtor.com active listings were up 7.6% year over year at October 31, up from 1.9% in June, though still 2.1% below October 2019. Bill McBride expects rising inventory and falling demand to push house prices down. That is his inference; the data do not yet show it. [1] [4]
The rate and inventory figures depend on the series. For the same period, the MBA's 30-year contract rate was 7.35%, while other outlets cite 7.51% to 7.58%. The MBA composite fell 2.3% seasonally adjusted but 5% unadjusted. Altos counts single-family listings only, while Realtor.com counts all listings, so their inventory levels are not interchangeable. [7] [8] [10] [11]
Measured data show contracts, applications and builder sentiment all falling while listings rise. McBride's view that this pushes prices lower is an inference. NAR's Lawrence Yun sees October as a possible bottom, which is a forecast, not evidence.
Executive brief
Pending home sales hit a record low in October 2026. NAR's index fell to 63.0, the lowest since the series began in 2001. It was down 4.7% from September and 16.7% from a year earlier, a steeper drop than the 2.0% decline economists polled by Reuters expected (NAR; IndexBox). The same week, builder confidence fell to 25, its lowest since April 2012, and mortgage purchase applications were 18% below a year ago. In CalculatedRisk, Bill McBride reads this as rising inventory meeting falling demand, which he expects to push house prices down.
What changed and event timeline
Inventory growth accelerates
National active listings in Realtor.com data were up 7.6% year over year at October 31, up from 1.9% in June. They were still 2.1% below October 2019 ().
Brief application rebound
MBA applications rose the week before, helped by lower rates (). That gain reversed the following week.
Mortgage applications fall
For the week ending Nov 13, the composite index fell 2.3% (seasonally adjusted). The 30-year conforming contract rate rose to 7.35% ().
Pending sales at a record low
The PHSI fell to 63.0, with month-over-month declines in all four regions ().
Capabilities and access
- NAHB/Wells Fargo HMI, November 2026, released Nov 17. Components: current sales 28 (−6), six-month expectations 30 (−2), buyer traffic 16 (−2) (NAHB HMI page).
- MBA Weekly Survey, week ending Nov 13. Refinances were 41.1% of applications (Haver).
- NAR PHSI, October 2026, released Nov 18.
Read the full section
The underlying releases are all free:
- NAHB/Wells Fargo HMI, November 2026, released Nov 17. Components: current sales 28 (−6), six-month expectations 30 (−2), buyer traffic 16 (−2) (NAHB HMI page).
- MBA Weekly Survey, week ending Nov 13. Refinances were 41.1% of applications (Haver).
- NAR PHSI, October 2026, released Nov 18.
- Altos Research weekly inventory, through Nov 13. It is published as a chart in the CalculatedRisk post, with no figure stated in the text.
Technical analysis for researchers and developers
- The MBA's 7.35% is a weekly survey contract rate (HousingWire). Other outlets cite 7.51% (CNBC) and 7.53% (HousingWire HMI). Haver reports 7.58% (Haver).
- The MBA's seasonally adjusted composite fell 2.3%, but the unadjusted figure fell 5%. Year-over-year comparisons use unadjusted data.
- Altos counts single-family listings only, while ResiClub uses Realtor.com totals. Their levels are not interchangeable: HousingWire cites 895,988 units, Realtor.com shows 1,183,520.
Read the full section
- Different series, different numbers. The MBA's 7.35% is a weekly survey contract rate (HousingWire). Other outlets cite 7.51% (CNBC) and 7.53% (HousingWire HMI). Haver reports 7.58% (Haver). Note the source and series before using any of them in a model.
- Adjusted vs unadjusted. The MBA's seasonally adjusted composite fell 2.3%, but the unadjusted figure fell 5%. Year-over-year comparisons use unadjusted data.
- Inventory sources differ. Altos counts single-family listings only, while ResiClub uses Realtor.com totals. Their levels are not interchangeable: HousingWire cites 895,988 units, Realtor.com shows 1,183,520.
Claims and evidence
- Purchase applications −18% y/y; refinances −54% y/y. Haver puts them at −18.4% and −53.9% (Haver).
- HMI lowest since April 2012; 46% of builders cutting prices; average cut 6% for eight straight months.
- Labor shortages, tariffs and regulation as causes. These are NAHB's own explanations, from an industry group, not measured findings.
Read the full section
- Purchase applications −18% y/y; refinances −54% y/y. MBA data (HousingWire). Haver puts them at −18.4% and −53.9% (Haver).
- HMI lowest since April 2012; 46% of builders cutting prices; average cut 6% for eight straight months. Primary NAHB survey data (NAHB).
- Labor shortages, tariffs and regulation as causes. These are NAHB's own explanations, from an industry group, not measured findings.
- October may be the bottom for contract signings. This is NAR economist Lawrence Yun's forecast. NAR is also a trade group (NAR).
- Price pressure ahead. This is McBride's inference, not observed data.
Context and prior work
- The MBA's Joel Kan tied rising rates to October inflation data and to Fed officials saying more rate hikes may be needed (HousingWire).
- CNBC puts the 30-year rate at 6.38% a year earlier (CNBC).
- Inventory growth slowed from 15.3% year over year in October 2025 to as low as 1.9% in June 2026, then sped up again (ResiClub).
Read the full section
- Inflation and Fed backdrop. The MBA's Joel Kan tied rising rates to October inflation data and to Fed officials saying more rate hikes may be needed (HousingWire).
- Year-ago comparison. CNBC puts the 30-year rate at 6.38% a year earlier (CNBC).
- Inventory trend. Inventory growth slowed from 15.3% year over year in October 2025 to as low as 1.9% in June 2026, then sped up again (ResiClub).
- Sales outlook. Yun says annual existing-home sales could be the lowest since the mid-1990s.
Limitations, safety and contested findings
Read the full section
- Conflicting rates. The 30-year rate figures disagree across sources (7.35%–7.58%) for the same period.
- Inventory still below 2019 nationally. Some regions are diverging: Florida inventory fell 10% year over year (ResiClub).
- Contested interpretation. Mish Shedlock argues NAR misreads the cause of the weakness (MishTalk).
- Soft data. The HMI is a sentiment survey, not a measure of transactions.
- Unverified macro figures. October CPI and Treasury yield figures circulating in secondary coverage are not confirmed here against BLS or Treasury data.
Business and practitioner implications
- HousingWire reports falling gross margins at Lennar (15.8% vs 17.5%) and PulteGroup (24.8% vs 26.2%), and a 53.8% cancellation rate at LGI Homes.
- Refinance volume is less than half of last year's. FHA refinances rose almost 7% while FHA rates were about 30 bp below conforming rates.
- Data to watch next: closed sales in Q4, Altos inventory against 2019, and the December Fed decision.
Read the full section
- Builders. HousingWire reports falling gross margins at Lennar (15.8% vs 17.5%) and PulteGroup (24.8% vs 26.2%), and a 53.8% cancellation rate at LGI Homes. These figures are as reported and were not checked against company filings (HousingWire).
- Lenders. Refinance volume is less than half of last year's. FHA refinances rose almost 7% while FHA rates were about 30 bp below conforming rates.
- Analysts. Data to watch next: closed sales in Q4, Altos inventory against 2019, and the December Fed decision. This describes the data only and is not investment guidance.
The source trail.
Sources (12)
Misc Data: Mortgage Applications Weak, Inventory Up, NAHB Builder Confidence Plunges
Article text retrieved; extracted text may omit tables or interactive elements.
calculatedrisk.substack.com