
MacroGrowth, inflation & jobs
US Existing-Home Sales Fall to 3.75 Million Pace in October, Slowest Since 2010
Existing-home sales dropped 5.5% in October to a 3.75 million annual rate as mortgage rates climbed, yet the median price still edged up to $416,700. Listings and months-of-supply are rising, while builders cut prices to move homes.
From the Calculated Risk article of November 16, 2026 and cited sources: October existing-home sales ran at a seasonally adjusted 3.75 million annual rate. [2] [5]
SOURCES[2] NAR: Existing-Home Sales Decreased 5.5% in October nar.realtor[5] Real Estate News: Existing home sales haven't been this… realestatenews.com
 AT Pulse research deskPublished · Updated · 4 min read · AI-assisted analysis
AI-assisted, not human-edited. Methodology Corrections Who owns this site
- What happened
- October existing-home sales ran at a seasonally adjusted 3.75 million annual rate. [2] [5]
- Original source
- Calculated Risk article, independent perspective
- Brief by
- AT Pulse research desk AI-assisted; publisher and contact on the desk page
- When
- November 16, 2026 article published
- Covered
- Nov 16 edition
- Evidence
- 6 sources across 6 sites
- 1CalculatedRisk: Part 1: Current State of the Housing Marketcalculatedrisk.substack.com
- 2NAR: Existing-Home Sales Decreased 5.5% in Octobernar.realtor
- 3KPMG: Builders are shrinking inventorykpmg.com
- 4Realtor.com October Housing Report (PR Newswire)prnewswire.com
- 5Real Estate News: Existing home sales haven't been this…realestatenews.com
- 6Fortune: Existing home sales fall to lowest level since 2010fortune.com
QuietHow it’s measured
Substack · 8 likes
Reach blends public engagement (views, likes, comments, shares, stars) from the platforms where the story or its original source lives: YouTube, Hacker News, GitHub, Substack and similar. A video and the article written from its transcript share one score, taken from the video. Platforms with no data are left out rather than counted as zero, and the age of a story never lowers its score.
October existing-home sales ran at a seasonally adjusted 3.75 million annual rate. That is down 8.8% from a year earlier and the slowest pace since August 2010. The median price still rose 0.4% year over year to $416,700, extending a run of annual gains to 40 consecutive months. [2] [5]
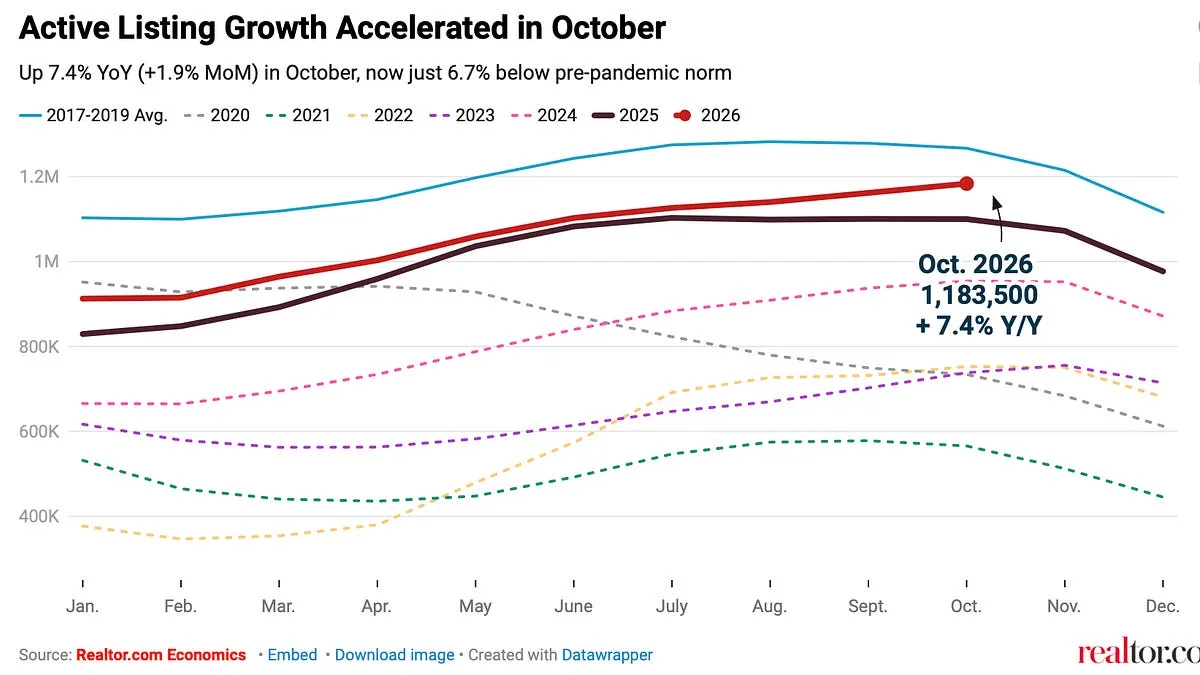
Supply is building while demand weakens. NAR's months-of-supply rose to 5.1 from 4.7. Realtor.com counted 7.4% more active listings than a year earlier, even as new listings fell 7.5% and homes under contract fell 10.5%. NAR counts closed sales, so the drop in contracts points to more weak months ahead. [2] [4] [1]
Builders are under pressure. September new-home sales ran at a 676,000 rate, with 8.4 months of supply, and 43% of builders cut prices in October. Completed homes for sale fell from 128,000 in January to 111,000 in September, but supply is still roughly double a balanced market. [3] [1]
Higher borrowing costs line up with the slowdown. NAR's chief economist said rates are at their highest since 2000, apart from one month in 2023, and the 30-year rate is up 110 basis points from a year earlier. About 49.1% of outstanding mortgages carry rates below 4%, which discourages owners from selling. Goldman Sachs trimmed its fourth-quarter GDP estimate by 0.1 point. [2] [4] [6]
The data show transaction volume at its lowest since 2010, with inventory rising and pending sales falling. As a result, brokerages, lenders and title firms face thin volume, builders face margin pressure, and forecasters see a modest drag on growth.
Executive brief
US existing-home sales fell to a 3.75 million annual rate in October 2026. That is the slowest pace since August 2010, down 5.5% from September and 8.8% from a year earlier (NAR). Prices have not given way: the median rose 0.4% year over year to $416,700. Mortgage rates averaged 7.33% in October, up from 6.86% in September, and that rise coincides with the drop in sales. Bill McBride's CalculatedRisk overview describes a market where listings are growing, months-of-supply is at its highest in over a decade, and homebuilders are cutting prices to clear inventory.
What changed and event timeline
New-home supply stays heavy
September new-home sales came in at a 676,000 rate, down 5.3% from a year earlier, with 8.4 months of supply. KPMG cites a builder survey showing 43% of builders cut prices in October ().
Listings growth speeds up
Realtor.com counted 1,183,500 active listings, up 7.4% from a year earlier. New listings fell 7.5% and homes under contract fell 10.5% ().
Existing sales hit their lowest since 2010
NAR reported a 3.75M rate and 5.1 months of supply, up from 4.7 in September (;).
Forecasters revise down
Goldman Sachs trimmed its Q4 GDP estimate by 0.1 point. Capital Economics expects sales to be weaker than it had forecast ().
CalculatedRisk overview
McBride notes that sales have run at very low levels for four years and that 2026 has been a difficult year for builders ().
Capabilities and access
The main data series: Most of the CalculatedRisk post sits behind a paywall. Its public portion covers only listings (CalculatedRisk).
Read the full section
The main data series:
- NAR monthly existing-home sales: closed sales, seasonally adjusted annual rate (SAAR), median price, inventory and months-of-supply (NAR).
- Realtor.com monthly housing trends: active and new listings, price cuts, pending sales, plus regional and metro splits (PR Newswire).
- Census new-residential sales: summarized by KPMG.
Most of the CalculatedRisk post sits behind a paywall. Its public portion covers only listings (CalculatedRisk).
Technical analysis for researchers and developers
- NAR counts closings, so October sales mostly reflect contracts signed in August and September.
- Realtor.com's active listings (1.18M, +7.4% from a year earlier) and NAR's inventory (1.59M, +4.6%) are measured differently.
- Listings usually decline in late-year data, as McBride notes (CalculatedRisk).
Read the full section
- Timing. NAR counts closings, so October sales mostly reflect contracts signed in August and September. Realtor.com's 10.5% drop in homes under contract points to continued weakness in the coming months (PR Newswire).
- Definitions differ. Realtor.com's active listings (1.18M, +7.4% from a year earlier) and NAR's inventory (1.59M, +4.6%) are measured differently. Don't compare their levels directly.
- Seasonality. Listings usually decline in late-year data, as McBride notes (CalculatedRisk).
- Base effects. Part of the faster year-over-year growth comes from a weak comparison period last fall (PR Newswire).
Claims and evidence
- Sales fell 8.8% year over year to a cycle low. Confirmed by NAR's primary data (NAR).
- Months-of-supply is the highest in over a decade. This is McBride's reading of 5.1 months (CalculatedRisk).
- Inventory is 6.6% below pre-pandemic levels, the narrowest gap since the pandemic. This is Realtor.com's own measure (PR Newswire).
Read the full section
- Sales fell 8.8% year over year to a cycle low. Confirmed by NAR's primary data (NAR).
- Months-of-supply is the highest in over a decade. This is McBride's reading of 5.1 months (CalculatedRisk). The NAR release confirms the figure but not the historical ranking.
- Inventory is 6.6% below pre-pandemic levels, the narrowest gap since the pandemic. This is Realtor.com's own measure (PR Newswire).
- Rates are the cause. This is the interpretation of NAR's Lawrence Yun and of Realtor.com's Danielle Hale. The data show the two moving together; they do not isolate cause.
Context and prior work
Read the full section
- Rate lock-in. About 49.1% of outstanding mortgages carry rates below 4%, which discourages owners from selling (Fortune).
- Unusually high rates. Yun said rates are at their highest since 2000, apart from one month in 2023 (NAR).
- Prices still rising. Median existing-home prices have risen year over year for 40 consecutive months.
- Rising rates. The 30-year rate is up 110 basis points from a year earlier (PR Newswire).
Limitations, safety and contested findings
- Builder inventory is mixed. McBride describes a large stock of completed homes for sale.
- The public excerpt says new listings were roughly flat in September. Realtor.com shows a 7.5% drop in October.
- Regional splits.
Read the full section
- Builder inventory is mixed. McBride describes a large stock of completed homes for sale. KPMG reports that stock fell from 128,000 in January to 111,000 in September, with total new homes for sale at a two-year low (KPMG). Both can hold: inventory is shrinking, but 8.4 months of supply is still roughly double a balanced market.
- Different months. The public excerpt says new listings were roughly flat in September. Realtor.com shows a 7.5% drop in October.
- Regional splits.
- Price trends: the South's median price fell 0.4%, while the Northeast's rose 3.2% (NAR).
- Sales: the West fell hardest, down 14.5% year over year.
Business and practitioner implications
- Brokerages, lenders and title companies face the lowest transaction volume since 2010.
- Builders are under margin pressure: price cuts are at their most widespread since at least 2020, and builder sentiment is at its lowest since June 2012 (KPMG).
- Modelers should treat the 20.5% share of listings with price cuts as a sign of seller restraint rather than distress, as Realtor.com does.
Read the full section
- Brokerages, lenders and title companies face the lowest transaction volume since 2010. First-time buyers made up 29% of sales, down from 32% a year earlier (Fortune).
- Builders are under margin pressure: price cuts are at their most widespread since at least 2020, and builder sentiment is at its lowest since June 2012 (KPMG).
- Modelers should treat the 20.5% share of listings with price cuts as a sign of seller restraint rather than distress, as Realtor.com does. They should also expect year-over-year comparisons to be distorted while the base period stays weak.